

This site uses cookies to deliver our services. By using our site, you acknowledge that you have read and understand our Cookie Policy. Your use of HR HUB's services is subject to these policies.

Let’s play out a scene.
You’re in a boardroom. The CFO asks, “Why is our attrition rising in Q3?” The CEO follows up, “Are we promoting fast enough from within?” All eyes turn to HR.
You feel a pit in your stomach because you think you know the answers, but all you have is a dozen scattered Excel files and last quarter’s guesswork.
Now imagine this instead: You open a sleek dashboard, tap a few filters, and boom—a real-time report with trends, department-wise breakups, and a predictive insight that shows exactly why this is happening.
That’s not a fantasy. That’s the power of reporting and analytics software in HR. And that’s how data turns into strategy.
For years, HR decisions leaned on “what feels right.”
Promote her—she seems ready. Hire faster—we’re short-staffed. Launch a survey—morale feels low.
But as companies grow, “feelings” don’t scale. That’s where analytics and reporting tools are flipping the script. These tools transform everyday HR data—such as attendance, leave patterns, feedback, and appraisals—into strategic foresight.
And here’s the twist: it’s not just about reporting what happened. It’s about forecasting what’s next, identifying potential issues, and crafting narratives from data.
Let’s break it down.
Reporting and analytics software in an HR context refers to a digital solution that collects, processes, visualizes, and interprets data related to employees. It transforms day-to-day operations, such as attendance, performance, leave management, learning and development, and even engagement scores, into actionable business insights.
But the best tools go far beyond just collecting and displaying data. They:
It’s not just a reporting engine. It’s a strategic decision-making engine disguised as software.

In the world of HR, not all reports are created equal. Some sit in your inbox, never opened. Others are powerful enough to shape the company’s next major decision.
Let’s explore the most impactful types of HR reports that go beyond documentation and drive strategy:
These reports provide a real-time snapshot of your current workforce distribution by role, department, location, and contract type (permanent, part-time, contractor).

When aligned with projected growth, business expansion, or seasonal demands, these reports help you:
Use case: A manufacturing company utilizes workforce planning reports to anticipate and preempt staffing shortages during peak production months.
Understanding why people leave is just as important as understanding why they stay. Retention reports analyze resignation trends across tenure, department, gender, location, and even post-appraisal periods.

This gives visibility into:
Use case: An IT company identifies that junior developers tend to leave between 10 and 12 months after joining. They introduce a mentorship program at 9 months and reduce attrition by 20%.
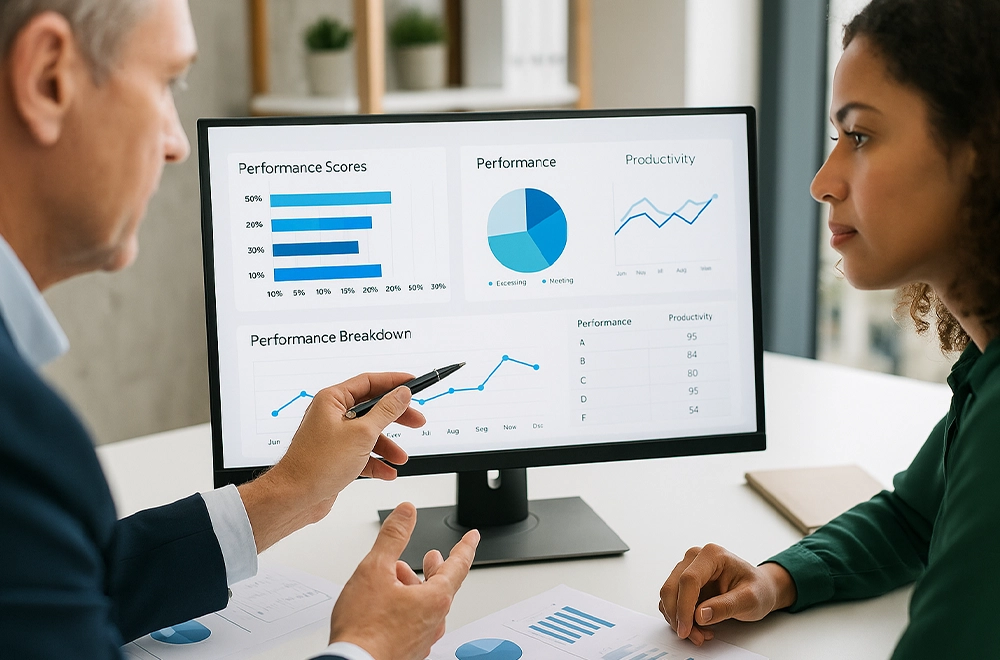
These reports don’t just show scores—they reveal growth, stagnation, or decline in employee performance.

When cross-referenced with training, tenure, or feedback scores, they help leaders answer:
Use case: A fintech firm utilizes performance reports to expedite internal talent development for leadership programs, thereby reducing costs associated with external hiring.
L&D reports tell you if training is just a checkbox—or if it’s moving the needle.

Key metrics include:
Use case: A healthcare provider conducts a clinical upskilling course and utilizes reporting tools to demonstrate improved patient handling metrics following training.
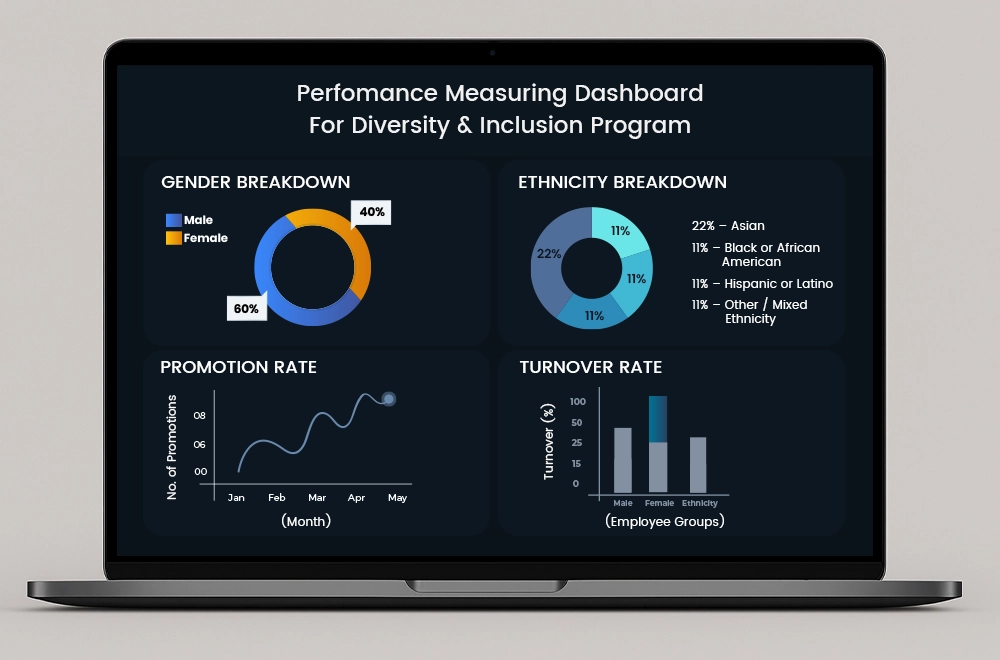
Progressive organizations are tracking DEI not just for optics, but for impact.

These reports offer insights into:
Use case: A global brand discovers a leadership pipeline gap for women. Their DEI dashboard triggers a leadership development program targeting mid-career women.
These heatmaps and leave pattern reports help HR spot:
Use case: A BPO utilizes absence reports to restructure shifts during high-absenteeism months, ensuring SLA compliance.

If you’re investing in reporting and analytics software for your HR operations, you’re not just buying a tool—you’re building the intelligence core of your workforce strategy.
A powerful analytics engine should not only visualize data but also help you interpret, act on, and share it across teams. Here's a closer look at the key features that separate a good tool from a truly strategic one:
Dashboards should no longer be static pages updated weekly. A robust analytics system offers live dashboards that automatically update with the latest activity across HR modules—whether it's new hires, resignations, training completions, or attendance anomalies.
Imagine your leadership logging into a single screen that shows:
Such real-time visibility allows HR to stay ahead of problems instead of reacting to them after it’s too late.
No two organizations analyze data in the same way. You might want a report comparing training hours with productivity metrics, while another HR team is tracking exit trends across age groups.
Your reporting tool should empower non-technical HR users to build, customize, and save reports without needing support from IT or data analysts.
Key capabilities should include:
The more flexible the report builder, the more adaptable it becomes to different HR use cases—whether it's boardroom reporting or day-to-day team insights.
It’s not enough to know that attrition is 18%. You need to know which teams, under which managers, in which region, and under what tenure bracket are leaving. Drill-down capabilities allow users to move from macro to micro views in seconds.
Let’s say you identify high absenteeism in one branch. You should be able to click and:
These deep dives help HR identify the real cause behind workforce issues, enabling the development of tailored solutions rather than blanket policies.
As workforce data accumulates, modern tools utilize artificial intelligence and predictive algorithms to identify patterns and forecast risks. These aren’t science-fiction features—they’re essential for strategic HR.
Your software should be able to:
This forward-looking approach transforms HR from a reactive firefighter to a proactive planner.

While custom reports are essential, ready-made templates allow HR professionals to move fast, especially for recurring needs. Look for systems that offer pre-configured reports for:
These templates are useful for routine operational tracking, audits, and compliance checks, significantly reducing manual report preparation time.
The most strategic insights often come from connecting the dots across modules. For example:
Ensure the reporting system integrates smoothly with modules like:
With integrated data, you're not just analyzing individual parts—you’re understanding the full employee journey.
Not everyone in your organization needs to see every HR metric. A truly effective tool allows you to control who sees what, while still empowering decision-making.
For example:
Role-based access ensures confidentiality, decentralizes insight, and maintains clarity for different audiences.
One of the most underrated features is the ability to receive alerts when data crosses a threshold, because HR issues often start small and grow quietly.
Look for software that lets you:
Such intelligent automation keeps your HR team constantly aware, even before anyone reports an issue.
Reports shouldn’t live in isolation. Your tool should allow:
Sharing insights with stakeholders in a format they understand is a critical part of building a data-driven HR culture.
Executives, HR business partners, and regional leads often work on the go. Whether a manager checks absenteeism trends from their phone or an HR head accesses live attrition stats before a board meeting, mobile access is now a must.
The software should offer:
When insights are accessible from anywhere, decisions don’t have to wait.
Visual storytelling isn’t just about looking pretty—it’s about simplifying the complex. Choose software that translates metrics into:
The goal is to make data digestible at a glance, especially for non-HR stakeholders.
With sensitive employee information being analyzed, compliance and traceability become crucial. Your tool must:
This is especially important in industries with stringent regulations, such as finance, healthcare, or government services.
In summary, choosing a powerful reporting and analytics tool means going far beyond dashboards. You need a system that thinks like an HR strategist, moves like a modern SaaS product, and acts like a trusted advisor—turning every HR number into a narrative of growth, risk, or opportunity.

Jumping into HR analytics can feel like diving headfirst into a sea of data, dashboards, and decisions. The good news? You don’t need to master it all at once. The secret to success lies in starting small, moving smart, and building momentum through clarity, not complexity.
Here’s a step-by-step roadmap that shows how even the most traditional HR teams can build a strong foundation in analytics—without stress, burnout, or chaos.
One of the biggest mistakes HR teams make is starting with “what can we track?” instead of “what do we need to solve?”
Before choosing any software or dashboard, start with clear, people-centric business questions, such as:
When your data strategy is built around specific goals, every chart and report has a purpose and adds value. This clarity ensures you’re not collecting data for the sake of it, but to drive decisions that matter.
Think of this as preparing your foundation before building a house. No matter how fancy your analytics software is, it’s only as smart as the data you feed it. Start by auditing all core data sources:
Investing time here prevents confusion, misleading reports, and distrust in your dashboards later. It also boosts data confidence across leadership.
Don’t get dazzled by vendors promising AI, NLP, or machine learning unless the basics are rock-solid. The ideal software should:
Ask yourself:
Don’t try to become a data wizard overnight. Instead, pick 3 to 5 high-impact dashboards to focus on for the first quarter. These should tie directly to your biggest current HR challenges.
Strong starting dashboards might include:
Focus on building muscle memory by using these consistently, gradually adding more as your comfort level grows.
Analytics can’t live solely within HR. To truly transform decision-making, managers and team leads need to be brought into the analytics loop.
Here’s how to make it work:
Your analytics setup is not a one-time project—it’s a living system that evolves with your business. The key to making it sustainable? Embedding it into your regular HR rhythm:
This loop helps you refine reports, kill what’s unused, and continuously evolve your analytics strategy.
Don’t let dashboards become another forgotten tab. Assign owners for each report or data domain. For example:
This ownership ensures every dataset is nurtured, tracked, and championed—like a living asset, not just static content.
In a world where data overwhelms but insights are scarce, the right tool makes all the difference. That’s exactly why HR HUB includes a fully integrated reporting and analytics module—purpose-built to make HR smarter, faster, and more strategic.
With HR HUB, you can:
The future of HR belongs to those who don’t just work with people, but understand them through meaningful metrics.
Because in 2025 and beyond, HR leaders don’t guess. They analyze. They act. And they lead.


Ready to streamline your HR processes? Contact us today to learn how HR HUB can help your organization thrive. Fill out the form, and one of our experts will reply shortly. Let's empower your workforce together!

